Inquiry – based learning (IBL) is an educational approach that emphasizes learning through student involvement in solving complex, authentic questions or problems (Lippmann, 2020). IBL envisions an active role for students in knowledge construction, and puts them on the driver seat. Students are encouraged to use tools that scientists and practitioners use to find a solution or explore a problem. Within the social sciences this entails that students undertake their own research: from framing a hypothesis or a research question, designing and implementing an appropriate research methodology, and finally analyzing and interpreting the results. The role of the instructor in such a learning process is that of a facilitator.
Inquiry based learning can aid in the development of conceptual, critical and analytical thinking of students. Students can learn to formulate hypothesis, evaluate “credible” sources of information, and further enhance their problem solving, analytical, composition, and communication skills. Involvement in such projects can lead to a greater appreciation for scientific, and systematic inquiry (Gasper and Gardner, 2013).
Undergraduate social science classes are often segregated into “Lab-based/Methods” courses and theoretical courses. Lab-based courses are highly technical, often smaller in size, and offer opportunities for students learn about “doing” research without acknowledging the theoretical basis underlying the processes it advocates. Conceptual or theory based courses, on the other hand, rely mostly on didactic pedagogies. This artificial binary within academia inhibits students from creatively engaging with theory and develop their application skills. Many experiential educators argue that “learning by doing” and direct experience offer the most powerful intellectual experience to learners (Roberts, 2012)
Inquiry based projects using Social Media
Educators in the social sciences have incorporated social media into the undergraduate classroom in innovative and engaging ways. The table below offers a small glimpse of social media projects that draw on principles of IBL. These could range from a 20 minute class activity to a semester long projects. Common pedagogical goals underlying these lesson plans or projects include creative engagement with learning materials, application of theoretical constructs in real life settings, and enhancing students critical and analytical skills.
Table 1 : Overview of Inquiry based activities/projects using social media
References
Freeman, S., Eddy, S. L., McDonough, M., Smith, M. K., Okoroafor, N., Jordt, H., & Wenderoth, M. P. (2014). Active learning increases student performance in science, engineering, and mathematics. Proceedings of the national academy of sciences, 111(23), 8410-8415.
Lippmann, M. (2020). Inquiry-Based Learning in Psychology. International Handbook of Psychology Learning and Teaching, 1-30.
Gasper, B. J., & Gardner, S. M. (2013). Engaging students in authentic microbiology research in an introductory biology laboratory course is correlated with gains in student understanding of the nature of authentic research and critical thinking. Journal of microbiology & biology education, 14(1), 25-34.
Roberts, J. W. (2012). Beyond learning by doing: Theoretical currents in experiential education. Routledge.
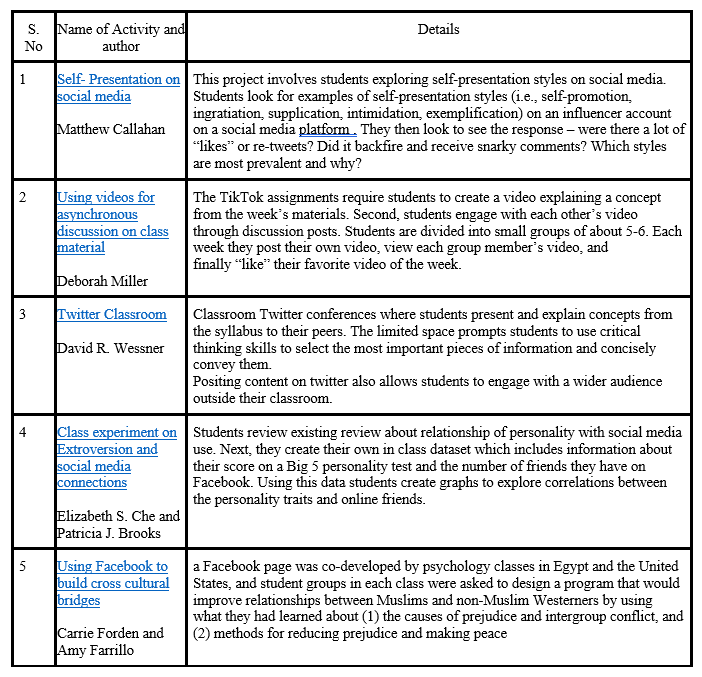
Today, digital spaces are an important and inescapable aspect of our social and personal lives. In 2005, only 5% of Americans reported using one or more social media platforms; by 2019, this number had risen to 72% (Pew Research Center, 2021). Furthermore, young people on an average spend between 2-6 hours on social media sites such as Facebook, Instagram, Snapchat, TikTok and YouTube (Statista, 2022).
Given the amount of time young people are spending on social media and how intertwined it is with their existence, connecting concepts taught in the classroom with what is happening on social media can potentially lead to enhanced learning outcomes. Research suggests that learning engagement is key to achieve superior academic outcomes (Freeman et al, 2014). When students perceive course content to be relevant and valuable to their personal and professional lives, they feel motivated to learn. Furthermore, understanding the rapid growth in engagement on social media platforms and their impacts on human behavior can be sites of inquiry themselves.
Most instructors require students to abstain from using social media in the classroom. The insights offered in this resource help us reimagine alternatives to surveillance, by mindfully integrating social media use as part of the lesson plan. This can create a classroom experience that is more “natural” for young people, and also open possibilities for conversations around thoughtful and meaningful social media engagement, and what it means for us.
Experiences shared on social media are “naturally occurring” i.e. they are not generated for the purposes of research. Unlike information gathered in a laboratory or through self report questionnaires, where there is a possibility that the information we gather can be artificial or biased, social media Therefore, it has potential to offer us unique insights about behavior in everyday life rather than data generated in artificial settings
Social media platforms offer a relatively economical, quick, and targeted way of collecting data, especially as compared to some other sources, e.g. polls, surveys, demographic and economic data. This data can useful for class projects and to help students analyze social phenomenon as they are unfolding in real time.
Rationale for this project
Designing class projects or assignments that draw on social media can be daunting for instructors in the social sciences for several reasons. First, many of us may lack the necessary resources to pull off such a project such as, access to a dedicated computer lab or proprietary software for data harvesting and analysis, and/or technical assistance to pull off these projects. Second, social media research is often perceived interchangeably with Big Data and computational methods. A related assumption is that instructors and students need to be well versed in coding in programming languages/software such as R or Python to undertake such projects. Third, it involves gaining familiarity with the rapidly evolving landscape of digital technology and social media platforms. The demands of an increasingly precarious, neoliberal academia are exhausting. The additional task of tuning into popular online culture, trending hashtags, or even the basic skills of navigating a new platform can feel overwhelming and an additional “burden”. This is especially for those of us (including myself) who do not identify as digital natives.
To address some of the concerns outlined above, this website draws on Open Educational Resources that require no previous familiarity with computer programming and need minimal investment in terms of learning new skills. Open Educational Resources (OER) are learning, teaching and research materials that are available in the public domain or are under copyright that have been released under an open license, that permit no-cost access, re-use, re-purpose, adaptation and redistribution by others (UNESCO). The OERCommons is a public digital library of open educational resources and a great database to begin exploring the world of OER.
For analyzing social media data, the website suggests methods that require little use of programming languages. These include primarily inductive and qualitative, approaches such as thematic analysis, grounded coding, and use of descriptive statistics. (For those curious to learn more about coding, there are a host of OER resources available online.)
References
Freeman, S., Eddy, S. L., McDonough, M., Smith, M. K., Okoroafor, N., Jordt, H., & Wenderoth, M. P. (2014). Active learning increases student performance in science, engineering, and mathematics. Proceedings of the national academy of sciences, 111(23), 8410-8415.
Pew Research Center (2021). Social Media Factsheet.https://www.pewresearch.org/internet/fact-sheet/social-media/
Statista Research Department (2022). Daily time spent on social networking by internet users worldwide from 2012 to 2022. https://www.statista.com/statistics/433871/daily-social-media-usage-worldwide/
Congratulations on reaching the final module! At this juncture, it is anticipated that students have gathered tweets using TAGS on a hashtag of their interest, analyzed their tweets by assigning codes or themes, and tabulated frequencies of various codes.
In this concluding phase of the project, we will be working to synthesize our observations based on the analysis. The format for the final output can be writing intensive in the form of an academic paper or blog post. Conversely, more auditory or visual formats such as oral presentation, an infographic, a podcast, or a short video could also be assigned.
Offering rubrics to help students frame their writing and narrate a compelling story is highly recommended. In the box below, I share one possible rubric for writing a blog post. These prompts may need to be modified to accommodate for the specific format of the final output.
RUBRIC FOR SOCIAL MEDIA POST
1.Introduction: What is your topic of interest? Which hashtag did you select and why ? Why is this topic important?
2. Methods : write a short paragraph explaining how you gathered tweets. Include details about specific criteria you included in TAGS for eg minimum no. of followers and explain the rationale behind it.
b. What sampling criteria did you to use to shortlist tweets for coding? Were there any tweets you excluded? (Explain why)
3. Results : a. Create a table that includes all your codes, along with a brief definition and an example tweet. Also include tabulated frequencies for each code or theme in the table
S.no
Theme
Definition
Sample Tweet
Frequency
1
Encouragement
Tweets that give support, confidence or hope to someone
everyday is a struggle. everyday we always need inspiration, and empowerment. life is not easy, but we will prevail in the end to become the better version yourself.
60%
Suggested table format for displaying results
b. Write a brief narrative describing your results. You could include information such as what are the most frequent codes or themes? Were there some codes or themes that stood out for you (even if they appeared infrequently in your results)
c. You may use tables, graphs, illustrations to describe your observations.
4. Discussion
What have been the key observations in your study? Discuss any patterns, reflections based on your results.
How does this relate to existing theories and peer reviewed literature?
Discuss the absences in the conversation on twitter. Where there certain issues that were not discussed? or certain groups of people excluded from the conversation
Finally, what are the limitations of your project? what would you have done differently if you had access to better resources (including extra time!)
Welcome to module three. In this section, we will be discussing about How do we make meaning of this large corpus of tweets? What are systematic approaches to data analysis ?
Overview of module:
1. Brief introduction to approaches for data analysis
2. Sampling
1. Brief Introduction to Approaches for Data Analysis
A random sample is when all observations/respondents in a population have an equal chance of being selected. For eg picking a number for bingo. For our project, an easy way to do this is to use a random number generator and select corresponding tweets from the TAGS archive.
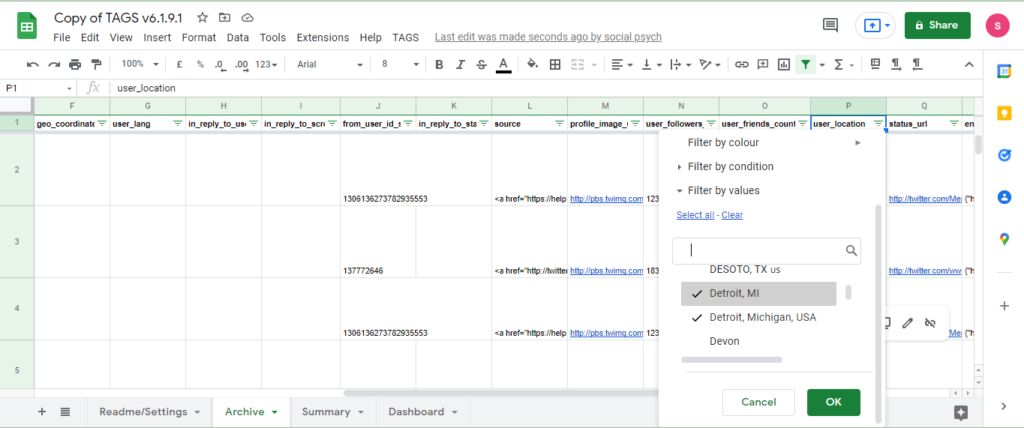
A purposive sample is when you select a sample of tweets, based on certain criteria. This criteria will depend on your topic of interest or your research question. For example, you might decide to select tweets of those residing in a certain region or in tweets by users of mental health services. In the former case, you can easily shortlist regions of interest by selecting relevant categories under “user_location” (Column P).
How to select regions of interest using the Google Sheets drop down menu
Note: If the number of tweets in your purposive sample is high , you might want to use a random number generator to select tweets from within the category
Welcome! Now that you have an understanding about twitter and how it can help us generate insights, let us jump right in and create a Twitter archive. In this module we will be discussing:
Before creating your archive it is important to select an appropriate research question. The research can be exploratory and need not have a specific hypothesis. For example, you may be interested in exploring reasons why women decided to leave or stay in a difficult relationship (Cravens et al, 2015) or understanding experiences of mental health service users (Shepherd et. al, 2015)
After framing your research question, narrow down a hashtag that is related to your research question. Alternately you could also use a case study approach and select an individual twitter account to retrieve tweets. Some important considerations while making this decision:
a. Select hashtags that cover larger topics and generate lots of activity, rather than more niche hashtags.
b. Since you can only collect data from last 6-9 days, you want to check the hashtag you are selecting that is in use NOW.
c. How a hashtag is used may change over time. For example during the George Floyd protests in June 2020 #BLM was being used to discuss racial violence. In May 2022, #BLM is associated with a much wider range of causes including promotion of black business and entrepreneurs.
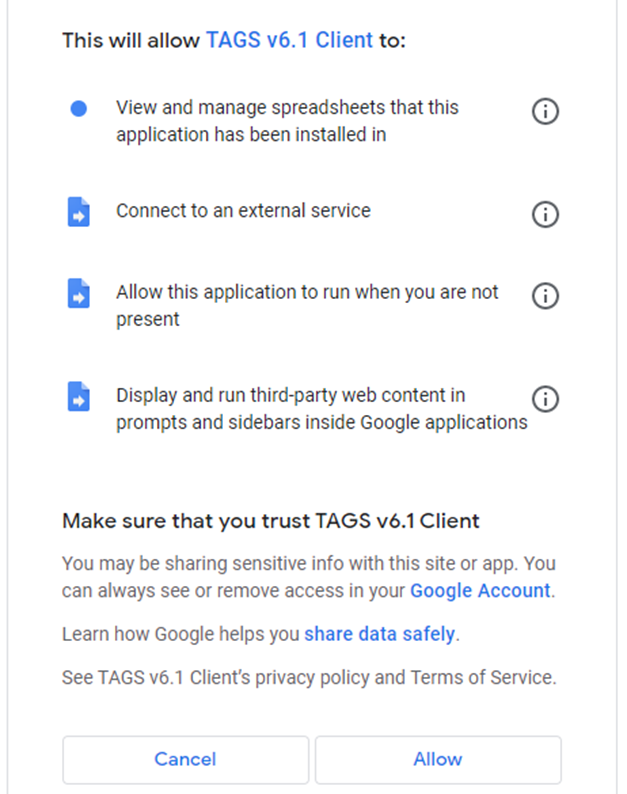
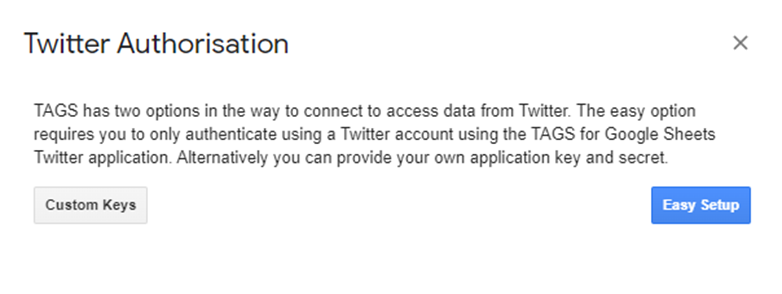
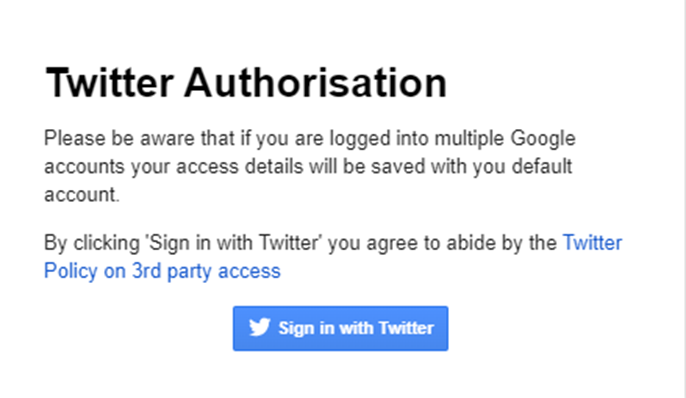
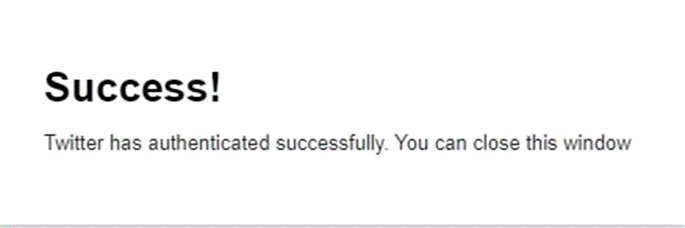
2. Create an Archive using TAGS
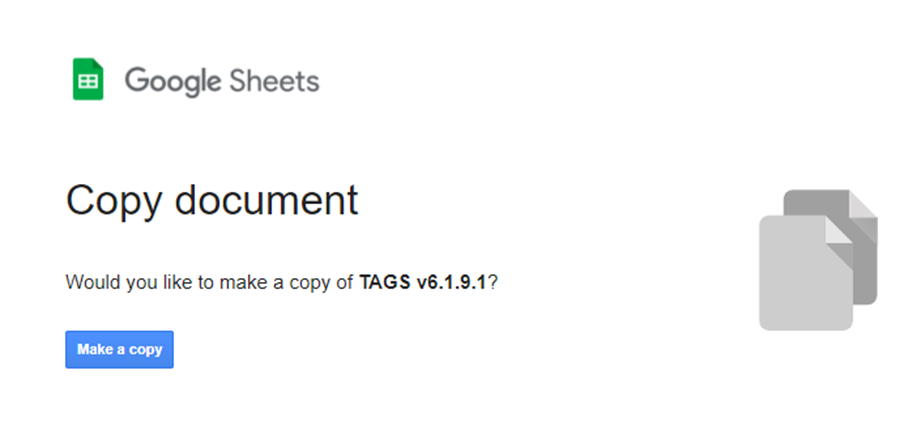
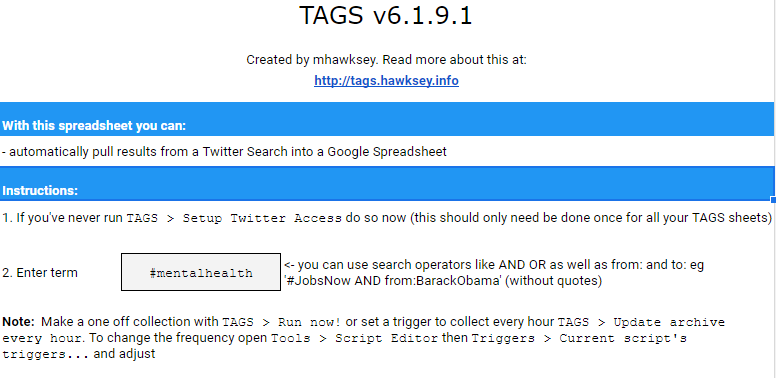
Open your TAGS Google sheet. Select the first tab “Readme/Settings” on the sheet. Under the section “Instructions”, type in the hashtag or search string you wish to query for in Item 2. Enter term -> #mentalhealth. You could create an archive for tweets where two hashtags are used together. Type in both hashtags separated by the phrase “AND” . For eg. #mentalhealth AND #safespace. You could search for tweets related to a hashtag posted by a single user. For eg you can run a query for “#BLM AND from:BarackObama”.
Entering a hashtag for TAGS to query
TAGS also allows you to set additional criteria for guiding the archiving process for the app. Under Advanced Settings -> Follower count filter you can enter the minimum number of twitter account must have for inclusion in the archive. This can help in potentially removing tweets from fake accounts in our archive.
You can also specify the total number of tweets you want TAGS to gather for your archive Advanced Settings -> Number of tweets
Setting additional criteria
You are now set.
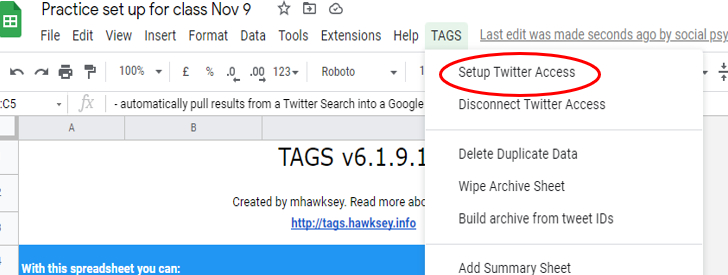
Click on the “TAGS” menu on the top right corner and select “Run Now!” TAGS -> Run now! You will see a small message window pop-up “Running Script” on the page. Allow the pop -up message to disappear. This may take a minute or two. Your archive is now ready!
Head to the second tab “Archive” on your Google sheet (you will find this at the bottom center of the page) to see your tweets.
You will notice that the column headers of your archive tab have headings such as “id”, “from_user”, “text”.
Highlight and select all tweets (Ctrl +A -> Ctrl +C) and paste them on a new google sheet (Ctrl +V). Save this new sheet and use it for analyzing and coding your tweets.
Additional functions
IMP: If you want to run a new search using a different hashtag, head to the TAGS menu option. From the dropdown menu, select “Wipe Archive Sheet”, and delete all previous tweets. Save a copy using the method described above if you want to keep a copy of tweets from your previous query.
Rather than gathering all your tweets at one point of time, you can set up TAGS to run queries at set time intervals. Head over to TAGS -> “Update archive every hour” to keep collecting tweets automatically. The TAGS tool will continue issuing hourly calls to the Twitter REST API without your active intervention. To stop, head over to TAGS > Stop updating archive every hour.
Cravens, J. D., Whiting, J. B., & Aamar, R. O. (2015). Why I stayed/left: An analysis of voices of intimate partner violence on social media. Contemporary Family Therapy, 37(4), 372-385.
Giannetti , F. (2022). Collecting Twitter data for Research. https://github.com/giannetti/collecting-twitter-data/blob/master/collecting-twitter-data.pdf
Shepherd, A., Sanders, C., Doyle, M., & Shaw, J. (2015). Using social media for support and feedback by mental health service users: thematic analysis of a twitter conversation. BMC psychiatry, 15(1), 1-9.
In this module, we will be covering the basics of doing research using Twitter. We will be exploring the following topics:
1. Overview of the project
2. Definitions of key terms
3. Scope and limitations of using Twitter for generating insights
4. Class activity: a brief stroll through Twitter land
1. Project Overview
Twitter is a microblogging social media channel that allows users to publish content in upto 280 characters along with images, and videos. Features such as hashtags, mentions, and replies, allows users to network and interact with other Twitter users, making it amenable for asynchronous interactions in a classroom settings. Apart from its communicative function, Twitter allows us to observe real time social phenomenon such as social interaction, information sharing, information seeking, self-documentation, and self-expression (Malik et. al, 2019). Data gathered from twitter can be helpful to measure short-term effects and/or look for insights (“trends”) relating to variables of interest.
For this project we will be gathering tweets using an OER called TAGS. Using TAGS, we will be creating an archive of tweets related to a particular hashtag (Module 2). These tweets will be analyzed using qualitative methodologies (Module 3). Finally, we will be presenting our insights based on what we have observed using a blog post, video, or infographic (Module 4)
2.Definitions of Key Terms
Social media are computer-mediated communication software that enable users to create, share and view content in publicly networked one-to-one, one-to-many, and/or many-to-many communications.(Hopkins, 2017)
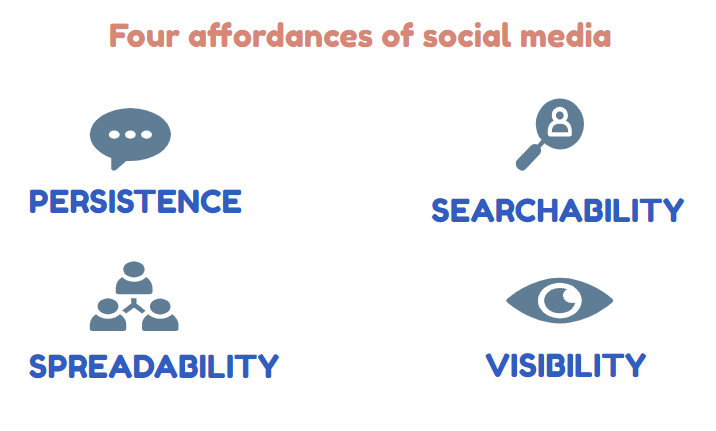
boyd (2014) decsribes social media as a form of networked public inhabited by young people (and others) that is charaterized by four structural affordnaces:
• Persistence: online expressions are automatically recorded and archived. • Replicability: social media content made can be duplicated with ease • Scalability: the potential visibility of content in networked publics is great. • Searchability: content in networked publics can be accessed through search.
Big Data: Big data refers to data sets that are too large or complex to be dealt with by traditional data-processing application software (Wikipedia).They can be characterized by 4 V’s: volume, velocity, variety, veracity (Chen and Wojcik, 2016)
Volume refers to the sheer scale of the data
Velocity refers to the speed at which data is generated and speed at which analytic processing is required
Variety refers to the many forms that big data can take—including structured numeric data, text documents, audio, video, and social media.
Veracity: handling the challenges and ambiguities of varying forms of data. Raw, unstructured data must be translated and structured to prepare them for analyses.
Tweet: A Tweet is a short message, status update or short-form content posted on social media platform twitter. A tweet, is limited to 280 characters, and may contain photos, GIFs, videos, links, and text.
Hashtag : hashtags are a word or phrase preceded by #. A hashtag is used to index keywords or topics across social media platforms, including Twitter. It is a way to indicate (for users and algorithms) that a piece of content relates to a specific topic or belongs to a category.
3. Scope and limitations of using Twitter for generating insights
Text from tweets provides us rich information about distribution of sentiments, understanding public discourse and opinions on current affairs or topics of interest, mapping individual characteristics of users such as political dispositions, personality traits, and observing information sharing behaviors. URLs (uniform resource locators) and mentions/retweets embedded in tweets can offer key insights into how people connect virtually, and the spread of false news on social media (Chen et al., 2021)
Examples of research articles that use twitter data
Walker, L. A., Williams, A., Triche, J., Rainey, L., Evans, M., Calabrese, R., & Martin, N. (2021). #StayMadAbby: Reframing affirmative action discourse and White entitlement on Black Twitter. Journal of Diversity in Higher Education.
Zhang, C., Yu, M. C., & Marin, S. (2021). Exploring public sentiment on enforced remote work during COVID-19. Journal of Applied Psychology, 106(6), 797–810. https://doi-org.ezproxy.gc.cuny.edu/10.1037/apl0000933
Limitations
a. You cannot retrieve tweets that are older than 6-9 days, without a paid account
b. Representation Bias: According to a survey conducted by PEW Research Center only 23% Americans are on Twitter. It difficult to make generalizations about the population as a whole based on Twitter data.
c. Eliminating bots : It may be difficult to discern human engagement vs. engagement generated by automated bots on twitter. A bot is software that may autonomously perform actions such as tweeting, re-tweeting, liking, following, unfollowing, or direct messaging other accounts. A study conducted in 2017 by Varol et. al estimated that up to 15% of Twitter users were automated bot accounts.
d.Missing contextual information: Due to limits set by the platform on number of characters, inclusion of other media etc, it maybe difficult to comprehend the exact context and meaning that the author intends to communicate through their tweet. Many researchers argue that automated computational tools lack the ability to understand context and nuance in human communication and language (Patton, 2020)
e. Issues of Consent: While there is consensus among researchers that information extracted from public accounts on Twitter does not require consent of individual participants, whether analyzing Twitter data counts as “human subjects research” is open to debate (Chen & Wojcik, 2016)
4. Class Activity
The objective of this class activity is to familiarize students to Twitter as a platform and understand how are hashtags used, by whom, adn for what kind of messages.
One of the most common ways that social scientists study behavior on twitter is by exploring hashtags. Simply put, hashtags are a word or phrase preceded by #. A hashtag is used to index keywords or topics on Twitter. It is a way for folks to indicate (for users and algorithms) that a piece of content relates to a specific topic or belongs to a category. Some examples of popular hashtags include:
Social movements: #BLM, #NotinMyName
Fandom communities around your favorite shows, movies, video games: #squidgames, #BLT, #sexeducation
For this class activity, participants can be divided into small groups of 3-8 members (depending on the class size)
Before beginning, you might want to shortlist one topic that the class in interested in exploring. You could select a topic related to the class syllabus, or something fun like #cats.
b. Make a list of popular hashtags that are being used in the tweets. Which ones are most common? are there some that are often used together?
c. What are the different type of accounts that tweet on this topic regularly? for eg companies? users? government? non profits?
d. Can you discern any pattern in the content of the tweets?
Participants can note their observations as a group and share with the class.
References:
Boyd, D. (2014). It’s complicated: The social lives of networked teens. Yale University Press.
Chen, E. E., & Wojcik, S. P. (2016). A practical guide to big data research in psychology. Psychological methods, 21(4), 458.
Chen, K., Duan, Z., & Yang, S. (2021). Twitter as research data: Tools, costs, skill sets, and lessons learned. Politics and the Life Sciences, 1-17.
Odabas M. (2022). 10 facts about Americans and Twitter. https://www.pewresearch.org/fact-tank/2022/05/05/10-facts-about-americans-and-twitter/
Malik, A., Heyman-Schrum, C., & Johri, A. (2019). Use of Twitter across educational settings: a review of the literature. International Journal of Educational Technology in Higher Education, 16(1), 1-22.
Patton, D. U., Frey, W. R., McGregor, K. A., Lee, F. T., McKeown, K., & Moss, E. (2020, February). Contextual analysis of social media: The promise and challenge of eliciting context in social media posts with natural language processing. In Proceedings of the AAAI/ACM Conference on AI, Ethics, and Society (pp. 337-342).
Varol, O., Ferrara, E., Davis, C., Menczer, F., & Flammini, A. (2017, May). Online human-bot interactions: Detection, estimation, and characterization. In Proceedings of the international AAAI conference on web and social media (Vol. 11, No. 1).
Studying online discourse around Mental Health on Twitter
This project explores discourse around mental health in digital spaces, specifically Twitter. By analyzing tweets associated with popular mental health hashtags, we try to examine ways in which the narrative around mental health is shaped online in the everyday. It allows to hear perspectives across a range of actors: users of mental health services and those associated with them, advertisers and corporations, political actors, and the general public.
We will be using TAGS, a free twitter archiving Google Sheet template that facilitates automated collection of tweets. Within seconds, and without typing a word of code, we can gather thousands of tweets! Sounds amazing, right?
Welcome ! This is an open educational resource (OER) for instructors in the social sciences for using project based learning using social media in the classroom.
Need help with the Commons?
Email us at [email protected] so we can respond to your questions and requests. Please email from your CUNY email address if possible. Or visit our help site for more information: